Newly Mapped Data Leads to New Insights
After working on the MAPA’s Revolution of Dignity in the 2016-2017 academic year, the MAPA team returned to the Great Famine project (Holodomor) for the Spring 2018 term. The previous stage of the Famine project had already produced important insights, and adding new, highly nuanced data promised to facilitate even deeper analysis.

Returning to the Famine project was a natural choice for MAPA, given the Holodomor’s importance in Ukrainian history and its research priority status for the Ukrainian Research Institute at Harvard. Not only did the MAPA program begin with the Famine project, HURI has a long tradition of supporting research on the Holodomor, from Robert Conquest’s The Harvest of Sorrow to Anne Applebaum’s Red Famine: Stalin’s War on Ukraine. Many research fellows have also carried out research on the Great Famine during their time at HURI.
As part of its effort to enrich the Famine web map with more data, HURI brought in demographer Nataliia Levchuk (Ptoukha Institute of Demography and Social Studies, Kyiv) as a HURI MAPA Project Research Fellow for the academic year 2017-1018. The contribution of demographers – in addition to historians – is part of what makes MAPA’s Holodomor research unique, and Levchuk has long been a part of this team.

During her first fellowship at HURI in 2013, Levchuk worked with MAPA Project Manager Kostyantyn Bondarenko and MAPA Director Serhii Plokhii to provide estimates of 1932-34 Holodomor losses in terms of excess deaths at a regional (oblast) level, further classifying by urban versus rural areas. To estimate 1933 population losses at the raion level, Nataliia Levchuk and a team of demographers, Oleh Wolowyna, Omelian Rudnytskyi and Alla Kovbasiuk, made population reconstructions of raions for the pre-Famine period 1926-1930 and the year of the famine 1933. They calculated excess deaths as the difference between all deaths in 1933 and expected number of deaths that would have occurred had there been no Famine.
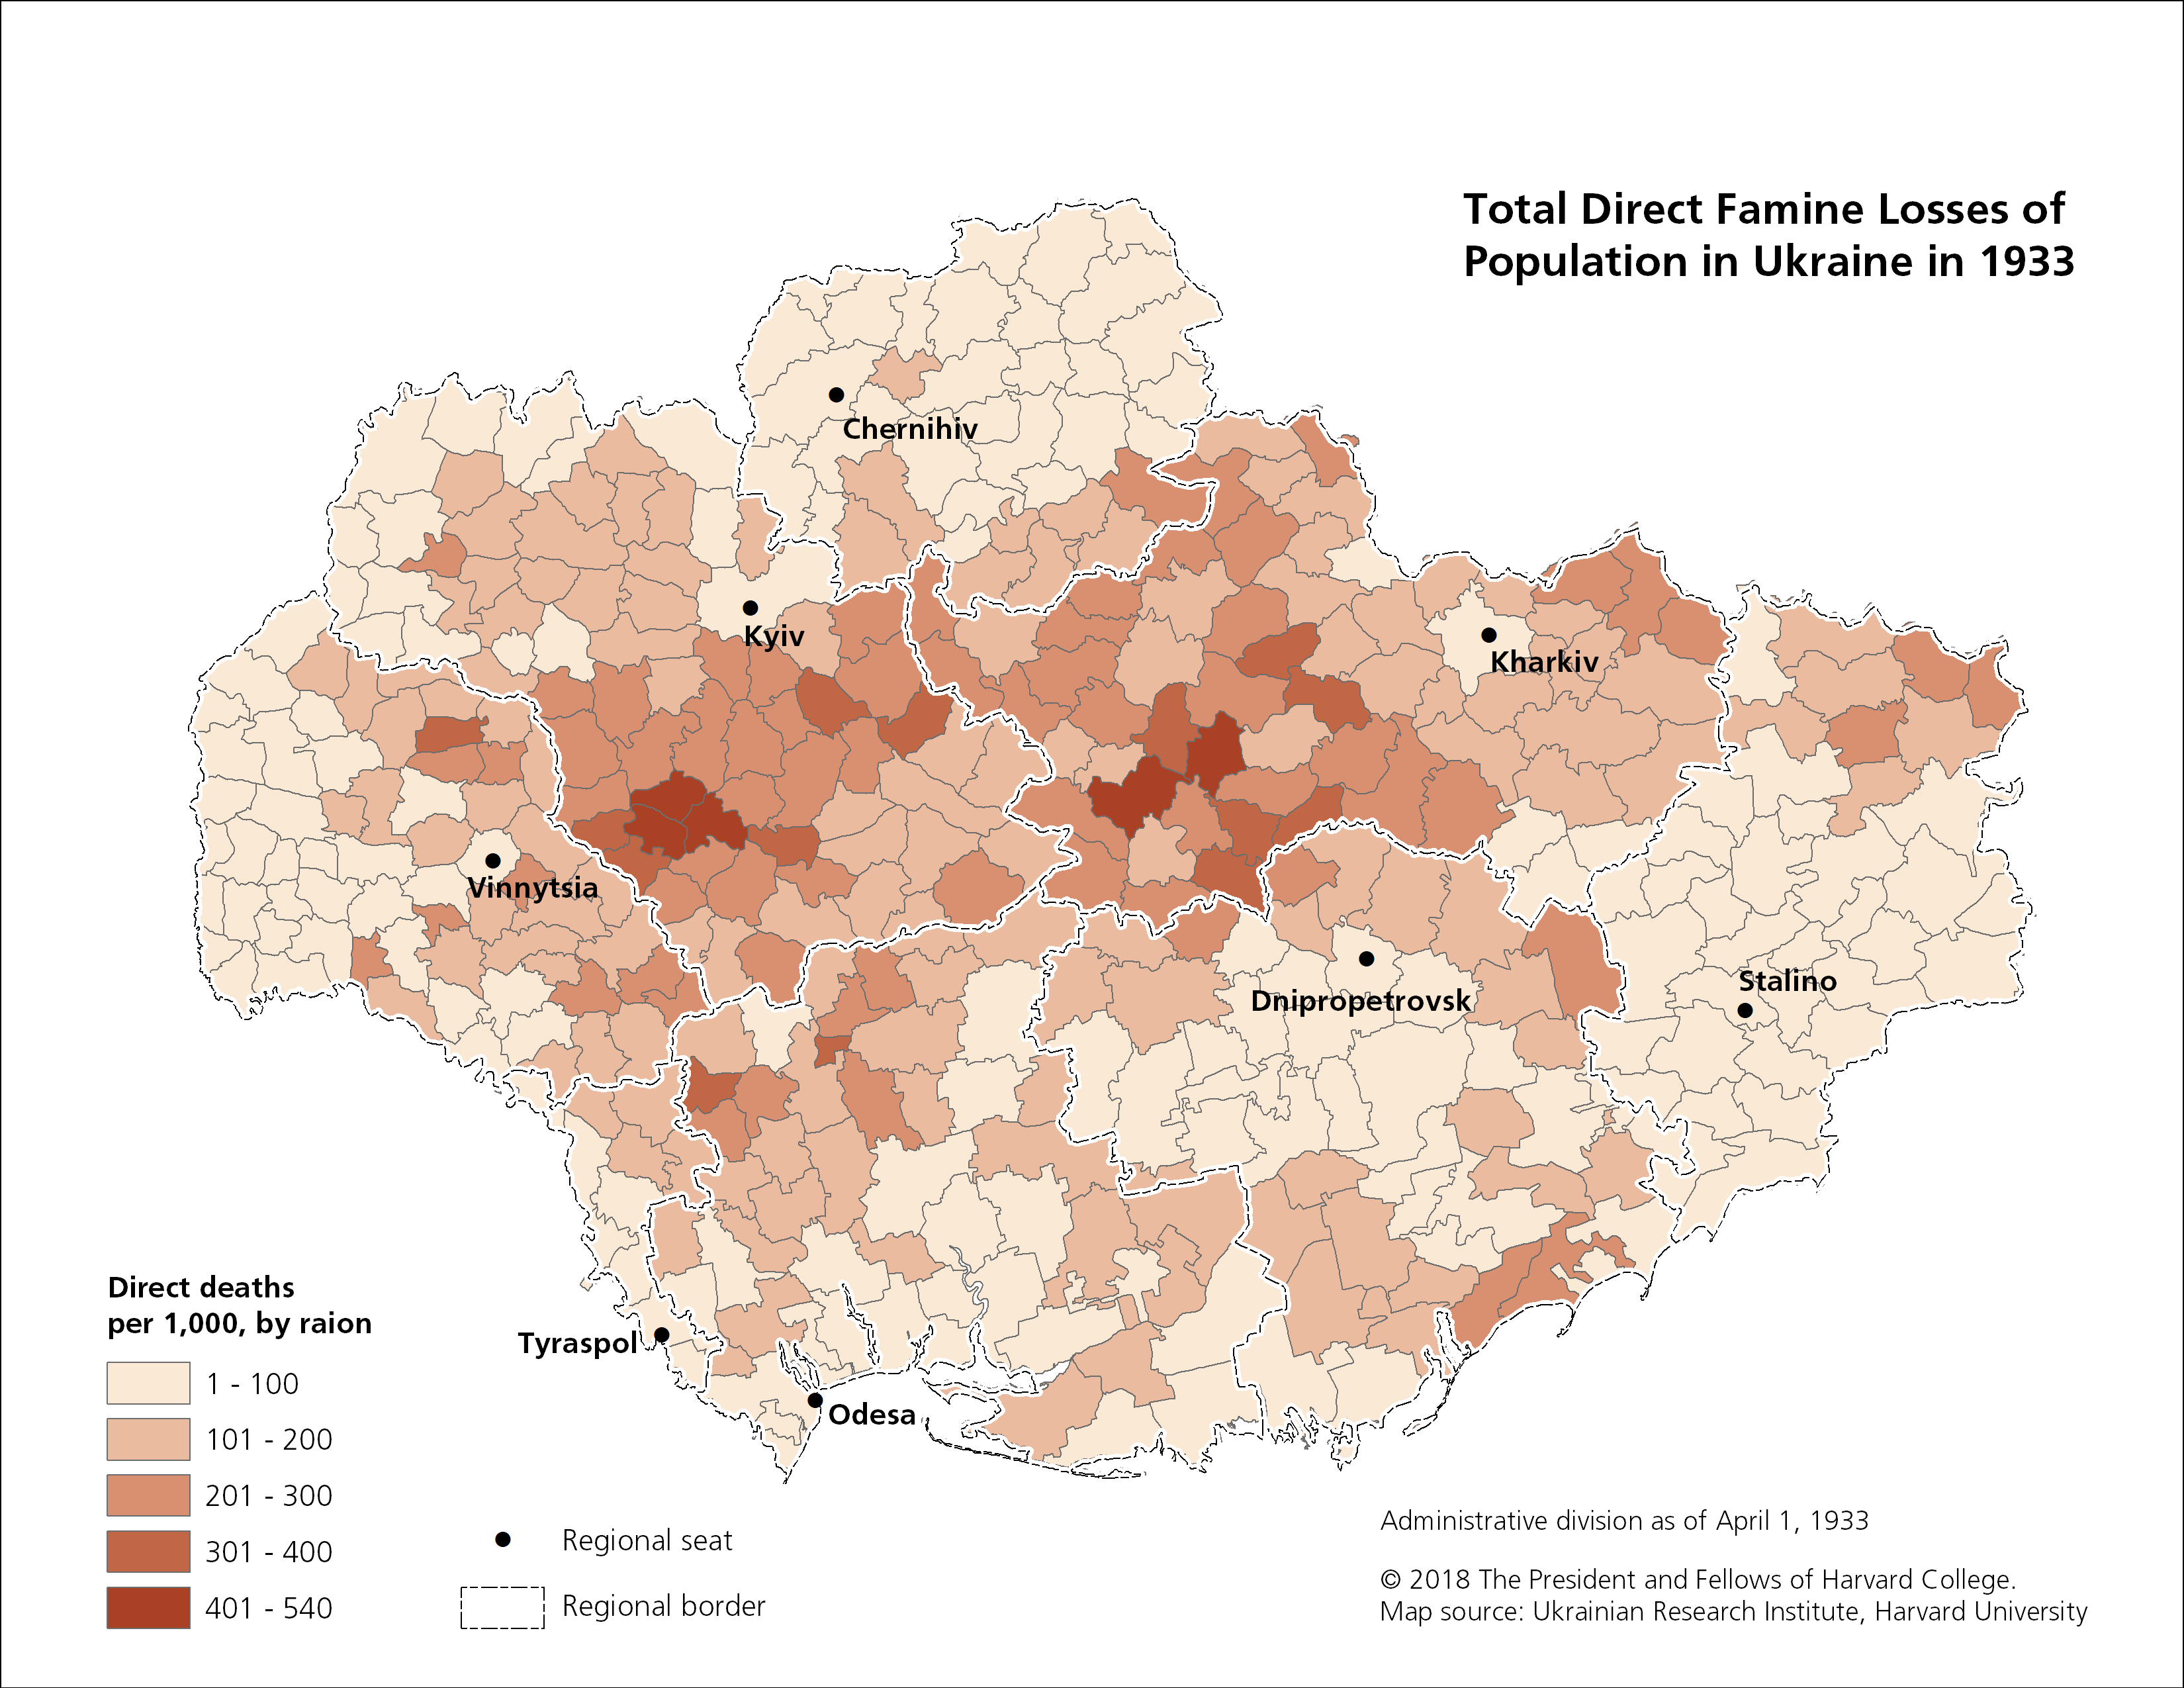
When the estimated values were mapped, the result came as a surprise to the MAPA team. With the 391 raions colored according to the number of excess deaths, they saw that the areas hit hardest by the Holodomor were not areas that specialized in growing grain – as is the case for natural famines. This changed the thinking on the Holodomor.
“Our estimates showed a very surprising pattern, in terms of the geographic distribution of losses,” Levchuk recalled. “Contrary to expectations, the highest losses were found not in the southern steppe regions of Ukraine (Odesa or Dnipropetrovsk), but in the north-central Kyiv and Kharkiv oblasts, which are not the prime grain-growing regions of Ukraine. It was a bit of a puzzle.”
Nuanced data for advanced analysis

To work on solving this puzzle, the MAPA team needed to examine how numerous variables differed across raions. During Levchuk’s 2018 fellowship, they added variables at the raion level, allowing for a much more nuanced analysis. “This time, my task was to try to explore a regional distribution of the 1933 rural population losses at the raion level, and to find possible determinants that might have contributed to such regional differences. We collected a lot of social economic variables and indicators from different statistical publications of that time.”
The new data effectively tripled the number of map layers available in the MAPA atlas for researchers to use, includes population statistics, such as rural population density and ethnic structure; economic indicators, such as grain procurement quotas, planned grain quotas, actual grain quotas, and percentage of fulfillment; geographical information about wheat crops, such as the percentage of land used for wheat, the percentage of crop area owned by independent farmers, collective, or state farms; and collectivization rates.
With these resources in the Famine web map, researchers and other MAPA users can see a more fine-tuned representation of how famine losses varied throughout Ukraine and explore which factors were significant causes of starvation in specific areas.
“Data visualization is a very promising way for us to comprehend quickly a large amount of data and then try to identify spatial patterns and relationships between variables,” Levchuk said. “This is not easy when you have a large data set in tables, but when you create maps, the picture is immediately clear. The MAPA project provides a new and effective aid in finding the answer to complex questions.”
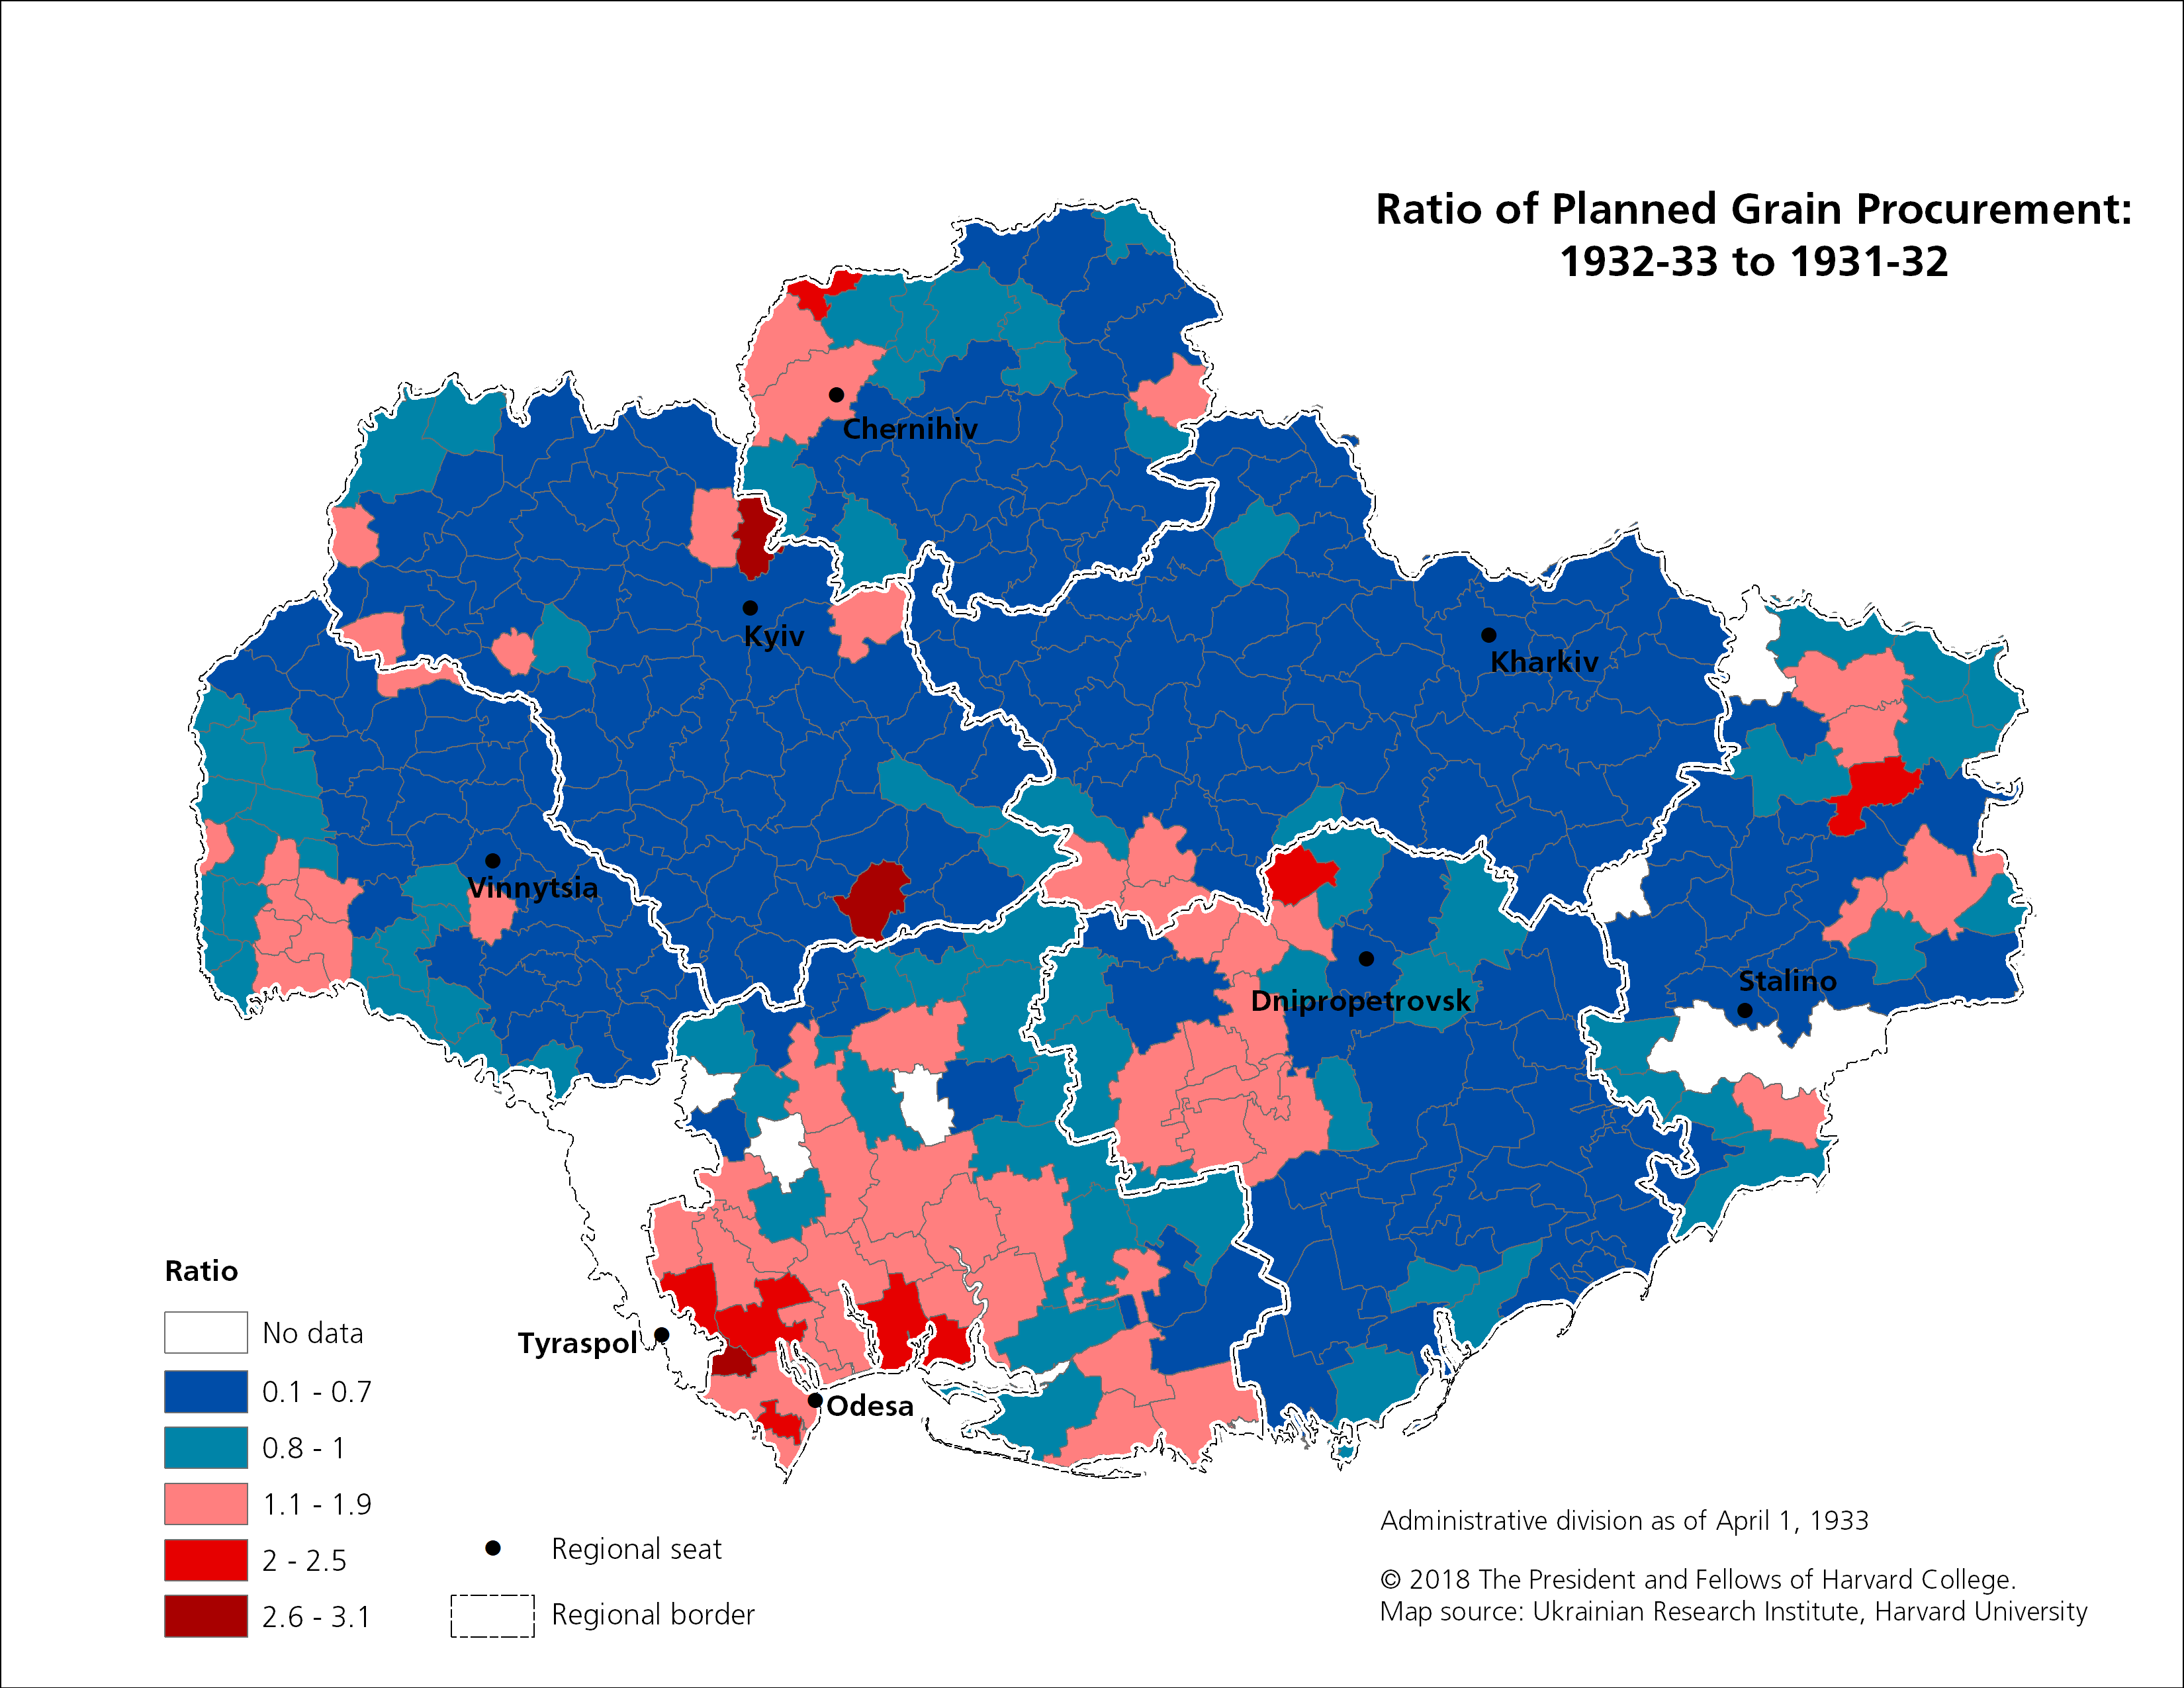
By the end of her fellowship at HURI, Levchuk developed a few preliminary hypotheses. “What we see is that something unique was happening, especially in the central parts of the Kyiv and Kharkiv oblasts. The highest excess deaths were mostly found in the central forest steppe zone of Ukraine, not in Odesa and Dnipropetrovsk, which are the prime grain-growing regions. When we looked at the grain procurement variables, it turned out that in 1932 Kyiv and Kharkiv oblasts got a large reduction in their grain procurement plan.”
The MAPA team was then faced with the question of why these areas had such extreme famine losses when they’d received a reduction in their procurement quotas. It turned out that the origins of the regional distributions of 1933 excess deaths started much earlier than in 1933: the period 1930-32 is very important for understanding what was happening in 1933. “Many raions in Kyiv, Kharkiv and Vinnytsia oblasts had a very good harvest in 1930, fulfilling or even over-fulfilling their quotas. The Soviet government decided to force an increase in their quotas for 1931, likely due to the success of 1930,” Levchuk explained.
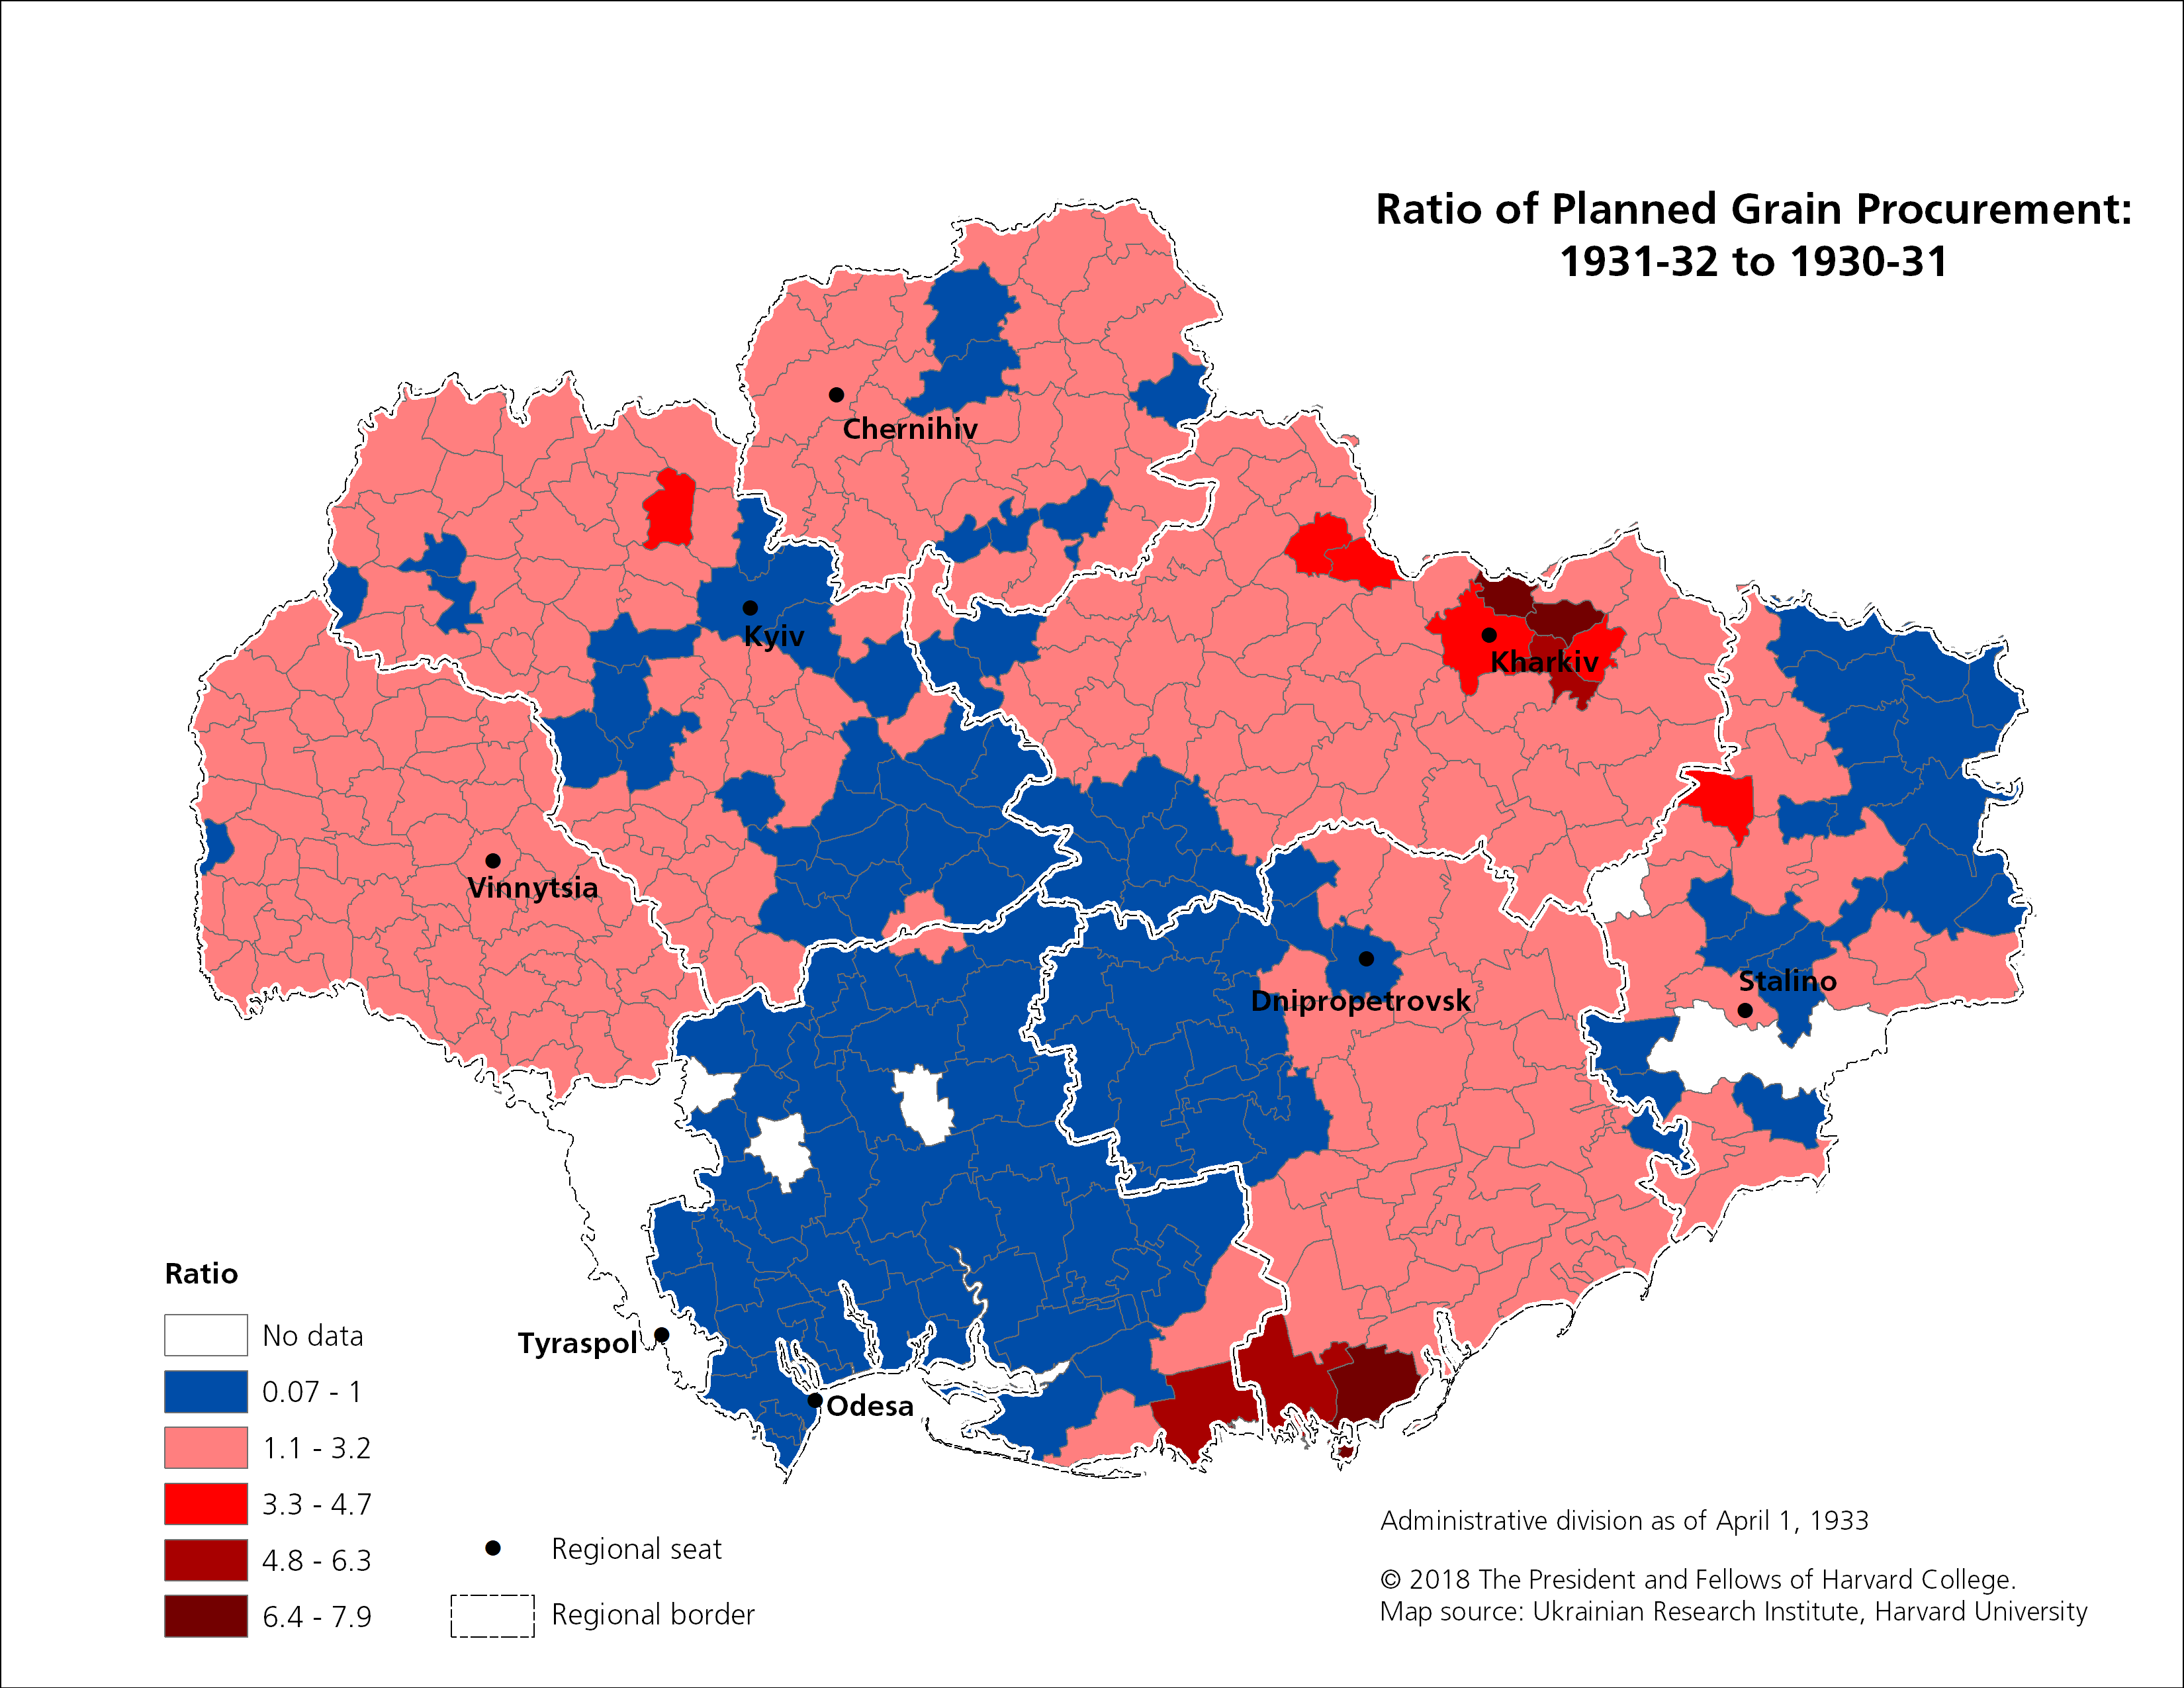
Notably, changes in grain procurement between 1930 and 1932 varied drastically across Ukraine. In 1931, the government did not intend to collect more grain from the most productive Odesa region but targeted the less productive Kharkiv, Kyiv and Vinnytsia. While quotas increased on average by nine percent throughout the country, raions in Kharkiv, Kyiv and Vinnytsia saw their quotas doubled, whereas the majority of raions in Odesa oblast and some raions of Dnipropetrovsk oblast (the prime grain-growing areas) had a reduction in their quotas.

“Moreover, we found that the distribution of the largely increased 1931 grain quotas in Kharkiv and Kyiv oblasts by raion was very uneven and unjustified because it was done disproportionally to the percentage of wheat sown area and their potential grain capacity” said Levchuk. Not surprisingly, Kharkiv and Kyiv were not able to fulfill such unrealistic quotas, possibly triggering the shortage of food by the end of 1931 and the early start of the famine in 1932 in these regions. The high concentration of famine deaths despite the 1932 reduction of quotas for these regions is less surprising given the extreme increase in 1931.There is a strong and significant correlation of 1933 excess deaths in Kyiv oblast with grain procurement quotas in 1930-1932. Other factors in quota decisions could include weather shock and collectivization rates, which Levchuk is beginning to examine now. “Our preliminary analysis shows that there was more procurement pressure on collective farms in less collectivized raions of Kyiv, Vinnytsia and Kharkiv and on independent farmers in more collectivized raions of Odesa oblast” she said.

She’s also working on a statistical model that will classify the 391 raions in Ukraine into smaller, homogenous groups based on famine-related data. This model will also help her identify which variables, such as grain procurement quotas, had the biggest influence on famine losses, explaining the variation in excess deaths across Ukraine.
Levchuk recently shared some of her insights with the HURI community at an event titled, “Mapping the Great Famine in Ukraine: Giving Voice to the Voiceless,” which is available for viewing on YouTube and includes an overview of the new resources available in the Famine web map. Levchuk also presented at the Association for the Study of Nationalities convention, which took place May 3-5, 2018 at Columbia University in New York, to the Ukrainian community in Boston later in May, and at the Holodomor Research and Education Centre in Kyiv in June. These efforts help to spread factual information about the famine while also introducing a powerful tool that researchers can use on their own to study the Holodomor. Encouragingly, recent website statistics show an increase in visitors to the MAPA site.
Complex causes, devastating outcomes
In addition to a research tool, MAPA serves as a powerful teaching device. Maps can be exported for use in presentations, and the statistics found in the project drive home the magnitude and complexity of the tragedy.
“There are some regions in Ukraine where more than 40 percent, and even more than 50 percent, died due to the famine,” Levchuk noted. “For instance, there are two raions, Tetiiv raion in Kyiv oblast and Hlobyne raion in Kharkiv oblast, where excess deaths constitute more than 50 percent of the rural population. It’s huge. I can’t imagine.”

"The large increase in quotas in 1931 was not enough to lead to such a massive famine," Levchuk emphasized. "We need to distinguish famine caused by excessive grain procurement from famine caused by all kinds of food requisition, which happened since the end of 1932 when most oblasts lagged behind in their grain fulfillment. The Soviet regime started a series of very severe repressive measures against peasants to push them to fulfill their quotas. These measures were spread almost across the whole territory of Ukraine."
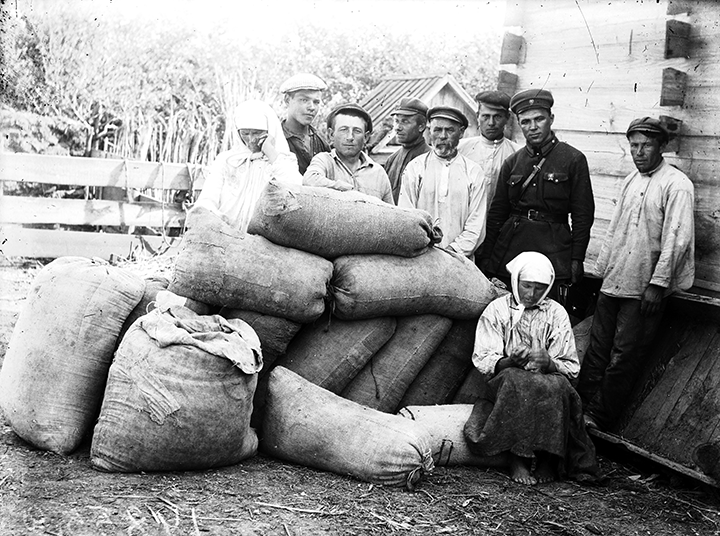
One such measure was putting entities on a blacklist (chorna doshka, literally “black board”) when they failed to meet their quotas. Blacklisted raions, collective farms, and other groups faced a range of punishments, culminating in a ban on trade, financial sanctions, and requisition of food, tools, and other goods. In short, all goods were taken away and no goods were supplied anymore.
“People were essentially condemned to death because everything was taken away. There was no food. Leaders started a requisition of all grain, all reserves, all seed to fulfill these quotas. Finally, they implemented fines in kind, which meant food of any type was taken away,” she explained.
In January 1933, the Soviet authorities sealed the borders of Ukraine. No one was allowed to move away to find food. The peak of the famine was in the first half of 1933. Eighty-five percent of the 3.9 million famine deaths in Ukraine occurred in the six months that followed.
“Overall, grain requisition alone does not account for this famine. Even if all of the grain were taken away, all peasants had some reserves,” Levchuk concluded. “If all food was taken away and people were prevented from leaving… only this can lead to such severe and massive famine.”
The MAPA team invites researchers to use the MAPA tools for their own work, and to get in touch with questions or to share discoveries.